Predicting industrial assembly time from a panel's design. An auditable prediction layer for modular manufacturing.
The problem
Estimates built from slow, manual references.
BluFab is the Casais Group company that industrialises modular bathroom panels. Today its production-time estimates still lean on manual references, the odd measurement exercise, and what the shop floor knows from experience. When an estimate misses, the cost is real:
- Commercial proposals priced against a reality that doesn't hold.
- Production planning built on numbers that drift.
- No reliable data to scale the business on.
The brief asked for a feedback loop connecting what gets designed, what gets manufactured, and how long each step actually takes. Ideally, it would predict manufacturing time before production starts, working from the design drawings, the bill of materials, and structured product data.
How we approached it
We broke the problem down before we built anything.
We started by breaking the problem into the pieces, then built the software around those.
First, we found what matters
We started with the raw resources the factory already had: design drawings, parts lists, hand-annotated timing sheets. Then, one question guided us: why does one panel take 8 minutes and another 30? A handful of features explained most of it. Naming those drivers and proving they mattered, before any modelling, is what cut our headline error nearly in half.
Then we designed for the human in the loop
Every screen assumes the operator knows more than the model. The prediction shows its reasoning, while the video timeline is a proposal to confirm or correct, not a final verdict. In essence, the machine does the tedious work, and the operator keeps the final say.
Finally, we put the operator in control of the data
A model is only as honest as the data behind it. So we gave the people closest to the line a way to see and shape that data, not just feed it. The interface surfaces outliers and asks the operator to explain or discard them. Every confirmed segment, corrected field, and flagged outlier feeds the next training round. The factory owns the loop.
The spine
Find the drivers · Keep the human touch · Let the floor shop own the data.
What we built
One interface with the AI pipeline underneath.
Cadence is a single interface. A panel gets estimated, the prediction gets challenged, the video timeline gets reviewed, and the dataset behind all of it is managed and grown. The models underneath are just plumbing.
- A prediction model estimates assembly time for a panel that has never been built: a total, plus a breakdown across 17 canonical micro-operations.
- A video annotator watches overhead-camera footage and labels it into the same 17 micro-operations, turning raw footage into structured, editable timings.
- The interface ties it together: PDF ingestion, feature extraction, the review screens, dataset and outlier management, the audit log and exports. That's what turns two models into a system an operator can actually run.
The product is the whole loop. The interface is what makes the estimate trustworthy, correctable, and better with every use.
Predicts a panel that doesn't exist yet
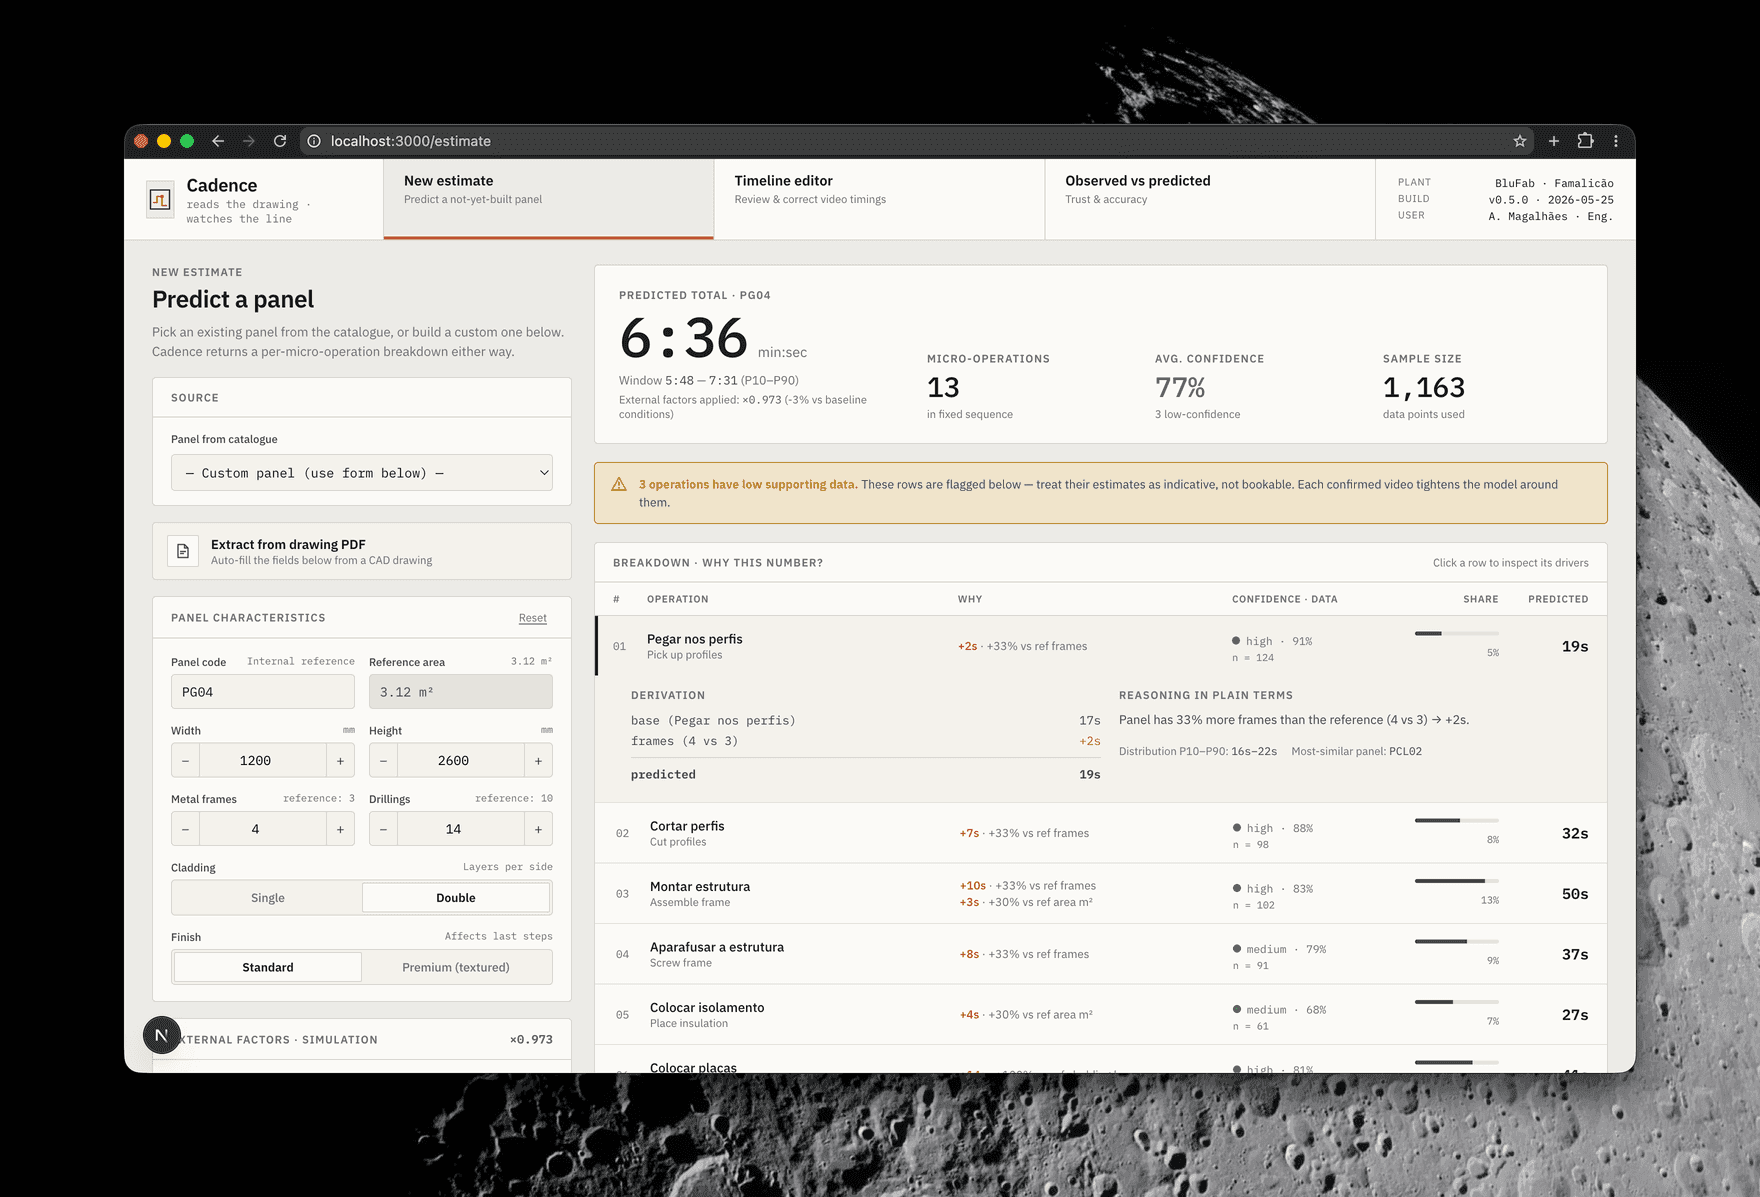
The fastest path is a drag-and-drop. In the New Estimate tab the user drops in the panel's technical drawing PDF, the same document the design office already produces. Cadence reads the PDF, extracts the structured variables (dimensions, metal frames, drillings, cladding type, finish), and runs them through the model. The extracted fields stay on screen and editable, and if there's no PDF, the operator can fill in the fields manually.
The estimate also accounts for conditions the operator sets: temperature and shift (morning, afternoon, late shift). A cold first-hour start is not the same as mid-afternoon, and Cadence doesn't pretend otherwise.
Each row of the breakdown shows the predicted seconds, which feature drove the number and by how much, a confidence band, and the sample size behind it. Where data is thin, the operation is flagged amber. The system is honest about what it doesn't know.
The Glass Box layer
An estimate is only useful if you can explain it. The reasoning sits in the interface, not buried in documentation:
- Why this number? Every prediction breaks down into deltas, like
+10s from +33% vs reference framesor+3s from +30% vs reference area. - Scenario simulation. Change a characteristic and the estimate recalculates, with the deltas shown.
- Append-only audit log. Every estimate is stored with its features, model version, and timestamp, built for ISO-grade auditability from the start.
Learns from the line
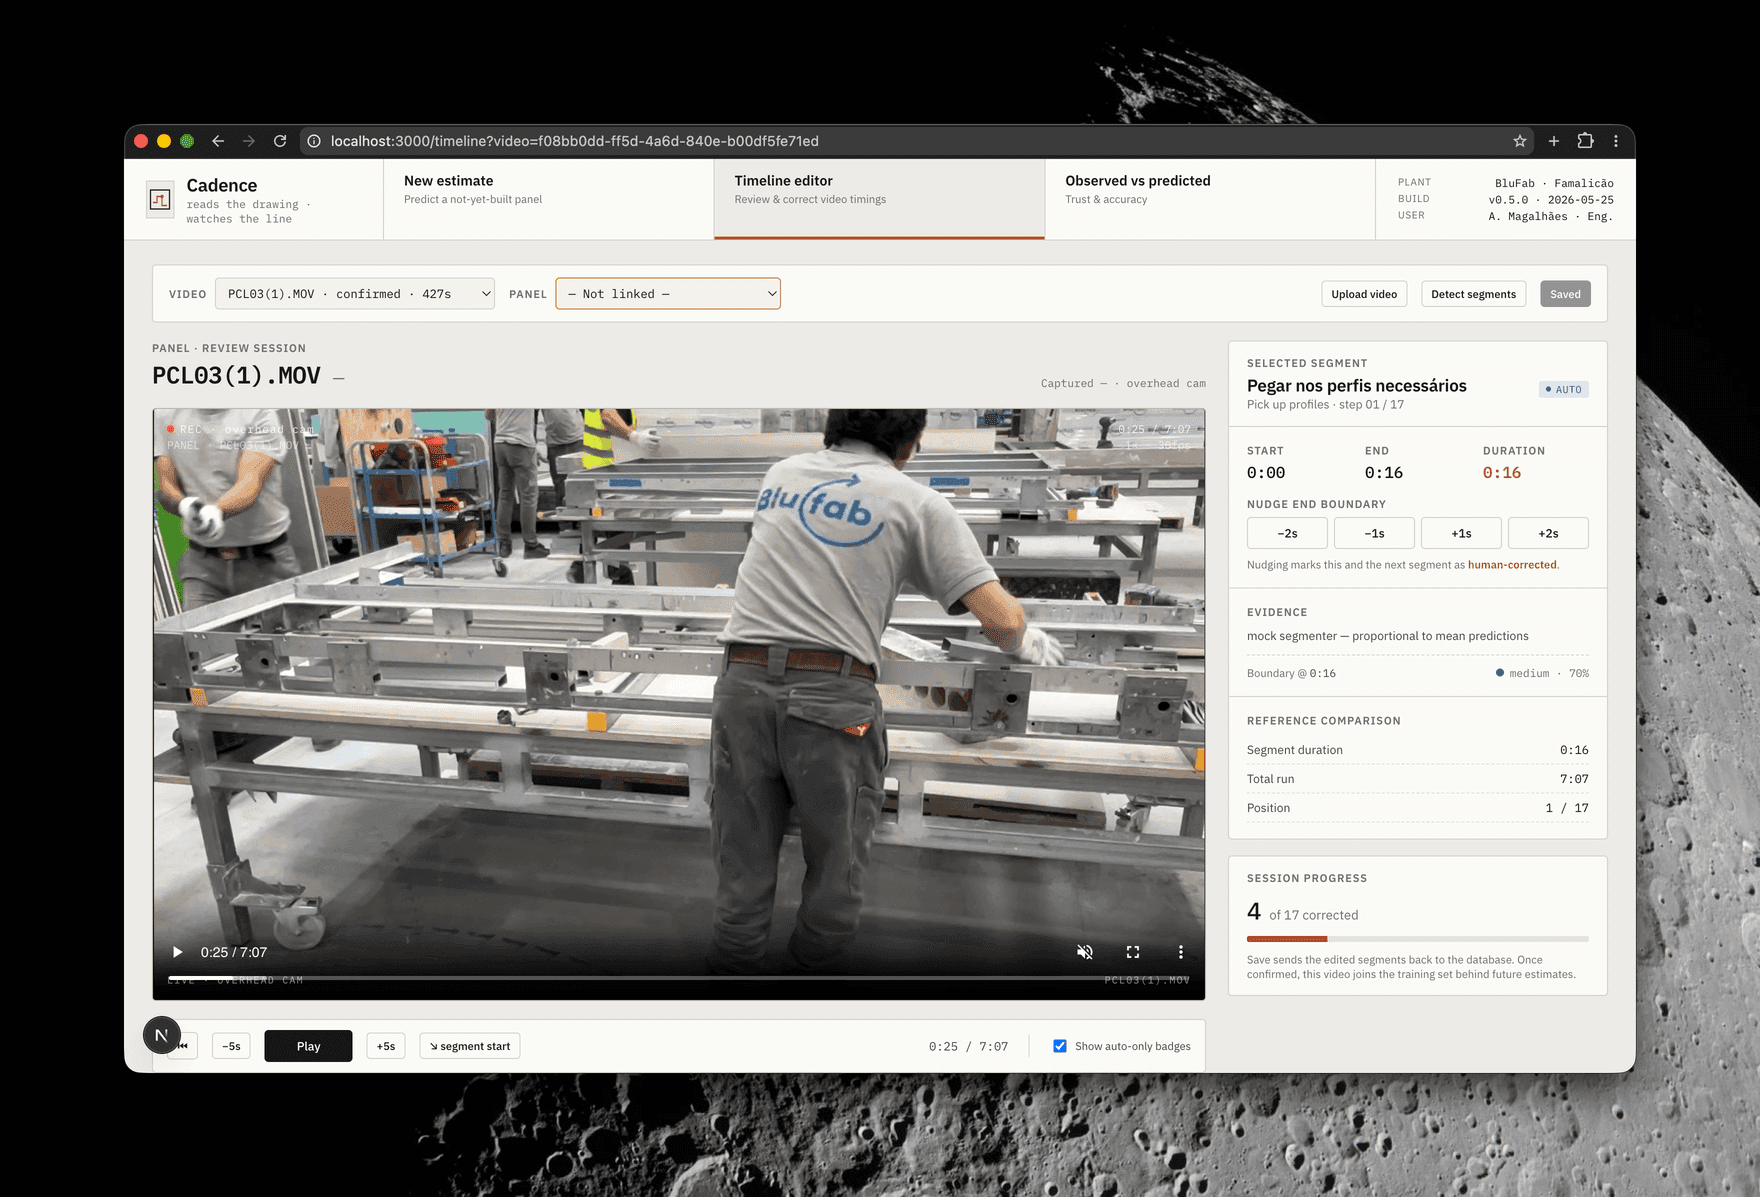
The overhead-camera footage is auto-segmented into micro-operations, then shown to the operator as an annotated timeline: labelled, playable segments (M01–M17) laid over the video. The operator checks it and adjusts any boundary in seconds.
The model proposes and the operator confirms. Each confirmed segment becomes a training label for the predictive model. Training is never the point of the screen. What the user comes for is the estimate.
Fits the factory's production system
Export to standard spreadsheet or data files (CSV, JSON), keyed on the production-order ID. Partial inputs work too: missing fields lower the confidence score and get flagged. Full MES integration is a next step for the pilot. It carried 10% of the judging weight, so we scoped it deliberately.
An AI assistant that ties it together
The last piece is an AI assistant built into the interface. Ask a question in plain language, get an answer, without leaving the screen. It handles two types of questions:
- About a prediction. Ask "why is this panel estimated at 15 minutes?" and it reads back the same plain-language reasoning the screen already shows, so no one has to decode a breakdown table to trust the number.
- About known panels and history. Ask "how does this compare to the PCL panels we've already built?" and it answers from the panel records and past timings already in the data, not generic guesswork.
How it works
Two models, one shared language of 17 micro-operations.
Both models share the same taxonomy (M01–M17), covering the panel from picking profiles to palletising. This is what lets each stage reinforce the other: the video measures durations per code, the model predicts them.
| Stage | Codes | Examples |
|---|---|---|
| Structure | M01–M05 | pick profiles, position, fix structure, measure, pre-board crimping |
| 1st & 2nd board | M06–M11 | place board, measure, screw, repeated for double-board panels |
| Finishing | M12–M14 | remove fasteners, flip the panel, post-flip crimping |
| Output | M15–M17 | label, palletise, move the table |
The prediction model — CatBoost
A CatBoost model (open-source, runs on an ordinary computer) predicts how long each operation on a given panel takes, from five families of inputs:
- Categorical — the operation, panel model, type, side.
- Composition switches — second board, box, drilling, internal structure.
- Profiles (metal frame) — counts, widths, total length, distinct part types.
- Boards (cladding) — counts by type, total & largest area.
- Contextual conditions — temperature and part of the day.
We always test on whole panels the model never saw in training (grouped cross-validation). It's the only honest way to rule out the model simply memorising.
The vision model — Qwen3-VL
An open-weights vision-language model (Qwen3-VL) that can look at images and describe what's happening:
- Sample frames — one frame per second, shrunk down.
- Group into 10-second windows.
- Label — the model picks one of the 17 operations.
- Find boundaries — a label change marks where one operation ends.
- Add up — total time per operation.
On an 11-minute test panel it labelled about 88% of the footage with a known operation. A simple filter skips frames where nothing changes, keeping the cost at cents per hour of video.
The decision that mattered most
One panel went from 40% error to 7.6% once the model learned to skip a second board on single-board panels. Adding the composition switches brought the average error on a panel from 21.2% down to 12.5%, mostly by zeroing out operations that don't apply to a given panel.
Results & evidence
Every number here is measured on panels the model never saw in training.
PICUA / PCL01K: 16 min 07 s actual against 15 min 00 s predicted, a 6.9% error on a real prediction. The breakdown accounts for the gap operation by operation.
Trajectory — measured, not hoped for
| Target avg error | Distinct panels (≈) | Horizon |
|---|---|---|
| 12.5% | 19 | achieved today |
| 10% | ~30 | short-term |
| 7% | ~60 | realistic 6-month target |
| 5% | ~120 | 12 months |
| <3% | — | limited by human variance, not data |
Why these decisions
- Transparency by design. Every number comes with its reason and a visible margin of error. Explainability is built in from the start.
- No vendor lock-in. Open-weights vision model, open-source prediction model, every component swappable. Each stage runs independently.
- Runs local. Both models run on a single machine, and the vision model can run entirely on-site (fully on-premise). Factory data never has to leave the building.
- Low cost. The video side costs cents per hour of footage. The prediction side runs on an ordinary computer, no specialised graphics hardware. One fixed overhead camera per cell, and existing camera setups are fine.
- Privacy by design. The system keeps only key frames and timings. Video becomes numbers, and the footage can be thrown away.
- Radical honesty. The system flags what it doesn't know instead of pretending.
| Layer | Choice |
|---|---|
| Prediction model | CatBoost (open-source gradient boosting) · runs on an ordinary computer |
| Vision model | Open-weights vision-language model behind a clean interface · hosted for fast iteration, can run entirely on-site |
| Storage | Append-only audit log · exportable as spreadsheet (CSV), data (JSON), or via an API |
| Stack | Python · CatBoost · FastAPI · Qwen open-source models |
Beyond BluFab
Built for any industrial process.
Bathroom panels were the pilot, not the ceiling. The same approach fits any industrial process with a structured product definition and a repeatable sequence of operations: automotive sub-assembly, furniture, prefabricated construction, electronics, food production, logistics handling. Find the variables that drive the time. Measure what actually happens on the floor, and close the gap between design and execution.
Once an operator can see where the time goes, which steps are outliers, and how a design change shifts the estimate, they stop guessing. The result is sharper quotes, tighter planning, a process that gets better with every unit it produces.
Let's build your Cadence.
Cadence is one example of what we can help you build. We take what industrial companies already know, from the shop floor, the data, the people who've been doing it for years, and turn it into systems that measure, predict, and improve.
If you're running an industrial operation and there's a process you're still estimating by feel, we'd like to talk.
Let's Talk